Table of Contents
R Tricks
removing trailing zeros from a vector
When you import data from the out put of other software, you might have trailing 0s at the end of each column:
> d0
 [1] 69.444 70.889 86.667 95.667 83.444 78.333 67.889
 [8] 56.000 49.222 40.333 37.889 31.889 30.333 26.667
[15] 22.444 23.111 20.889 22.000 20.111 19.778 20.778
[22] 19.667 17.333 19.333 19.000 16.333 14.444 13.889
[29] 18.000 21.778 23.556 23.889 28.778 40.000 48.667
[36] 55.889 66.667 78.889 72.222 84.778 68.778 69.444
[43]  0.000  0.000  0.000  0.000  0.000  0.000  0.000
[50]  0.000  0.000  0.000  0.000  0.000  0.000  0.000
[57]  0.000  0.000  0.000  0.000  0.000  0.000  0.000
[64]  0.000  0.000  0.000  0.000
To remove them, there could be many ways, but here is my one liner.
d0c <- d0[rev(cumsum(rev(d0)))>0]
Then the output is
> d0c
 [1] 69.444 70.889 86.667 95.667 83.444 78.333 67.889
 [8] 56.000 49.222 40.333 37.889 31.889 30.333 26.667
[15] 22.444 23.111 20.889 22.000 20.111 19.778 20.778
[22] 19.667 17.333 19.333 19.000 16.333 14.444 13.889
[29] 18.000 21.778 23.556 23.889 28.778 40.000 48.667
[36] 55.889 66.667 78.889 72.222 84.778 68.778 69.444
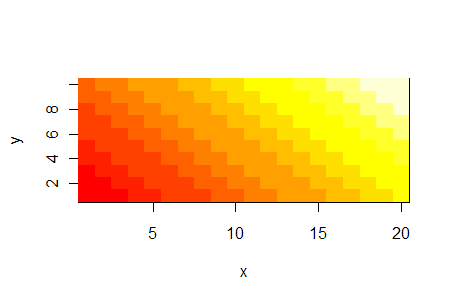
Plotting a matrix data as a color-coded image
#a 2Dplot, color coded.
x <- c(1:20)
y <- c(1:10)
for(j in y){
  for(i in x){
    val <- i+j
    if((i == 0) & (j == 0)) z <- val
    elsez <- append(z, val)
  }
}

z <- matrix(z, nrow=20, ncol=10)
mat <- list(x, y, z)
image(x, y, z)
… a bit faster way calculation wise uses indexing.
width <- 10
height <- 20
x <- c(1:width)
y <- c(1:height)
xindex <-rep(x, length = width*height)
yindex <- yindexing(x, y)

z <- xindex + yindex

z <- matrix(z, nrow=width, ncol=height)
mat <- list(x, y, z)
image(x, y, z)

yindexing <- function (x, y) {
  for(i in y){
    cr <- rep(i, length=length(x))
    if (i==1) all <- cr
    else all <- append(all, cr)
  }
  return (all)
}
Inserting math formula & symbols in label or title
The easiest way is to use function expression(). For example,
plot(back$V2, type='l', xlab=expression(slice %.% time), ylab='intensity', xaxt="n", yaxt="n")
Inserts vertically centered dot in the x label between “slice” and “time”. You could check other available expressions by
?plotmath
More recent, but under development is using tikzDevice.
Variable Name to String
myfunc <- function(v1) {
  deparse(substitute(v1))
}

myfunc(foo)
[1] "foo"
